

A page can rank #1, pull in 40,000 monthly impressions, and still generate zero revenue. That is not a hypothetical. It happens constantly to pages that win on a keyword nobody buys anything from. If your SEO reporting stops at rankings, traffic, and impressions, you are measuring visibility, not the thing your business actually cares about.
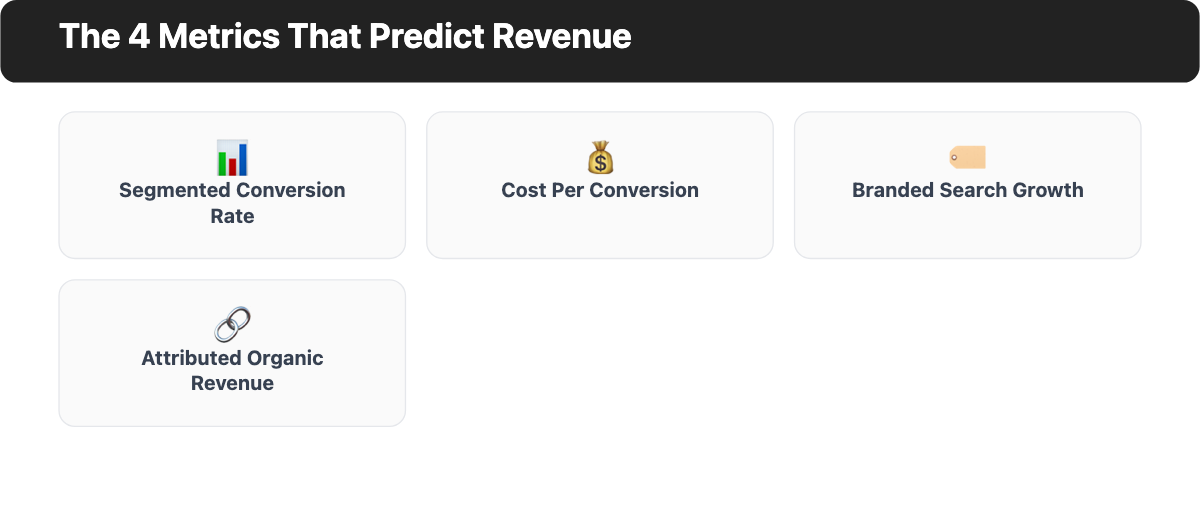
Which SEO metrics actually predict revenue? In practice, a small set of metrics carry almost all the signal: segmented conversion rate (not the blended site-wide average), cost per conversion, branded search growth, and assisted or attributed organic revenue. Everything else, including raw rankings, total impressions, and domain authority, is either a leading indicator worth watching or a vanity number that looks good in a slide deck and tells you nothing about your bottom line.
This guide walks through why the popular metrics mislead, the framework for sorting signal from noise, the specific metrics worth tracking with typical benchmark ranges by business model, how to actually set up the tracking, and how to forecast the revenue impact of SEO work without overpromising.
Why Most SEO Metrics Don’t Predict Revenue
Rankings, impressions, and raw organic traffic measure one thing: whether people can see your page. They say nothing about whether those people wanted what you’re selling.
A common failure pattern looks like this: a page ranks #1 for a long-tail, informational query. Impressions climb into the tens of thousands. Traffic goes up and to the right in every search visibility dashboard.
Then someone asks how much revenue that page generated, and the honest answer is close to zero, because the query behind all that visibility was never a buying query in the first place. The visitors were researching, comparing, or just curious. None of that shows up as a lead or a sale.
The deeper problem is that these metrics measure supply, not demand fit. A ranking tells you Google thinks your page is a relevant answer to a query. It does not tell you whether the person searching that query was ready to act.
Two pages can have identical rankings and identical traffic volumes and produce wildly different revenue, because the intent behind their traffic is different. Confusing visibility with commercial value is the single most common reporting mistake in SEO, and it is why so many teams can point to a dashboard full of green arrows while revenue stays flat.
The Leading, Bridge, and Revenue Framework
Not every SEO metric needs to predict revenue directly for it to be worth tracking. The mistake is treating all metrics as if they belong on the same tier. A more useful way to organize them is by how close they sit to an actual transaction.

Leading indicators move first and fastest. Rankings, impressions, and indexation status fall here. They tell you whether your visibility is changing before anything downstream has had time to react. They are useful as an early warning system, but on their own they cannot tell you whether that changing visibility will ever turn into money.
Bridge indicators sit in the middle. Click-through rate, sessions from organic search, and pages per session belong here. They tell you whether the visibility you’re generating is actually pulling people in and holding their attention.
A bridge metric moving in the right direction is a good sign, but it is still one step removed from revenue, because attention is not the same as intent to buy.
Revenue indicators are the metrics with a direct or clearly attributable line to money: segmented conversion rate, cost per conversion, branded search growth, and assisted or attributed organic revenue. These are the metrics this article focuses on, because they are the ones that answer the question a finance team actually asks: did this work pay for itself.
The practical use of this framework is diagnostic. When a leading indicator moves but nothing downstream follows, that is a signal the traffic you’re winning doesn’t match buyer intent. When a revenue indicator moves without a corresponding leading-indicator shift, that usually means something changed in your funnel, not your search visibility, and the fix belongs somewhere other than SEO.
Which SEO Metrics Actually Predict Revenue
Segmented conversion rate, cost per conversion, branded search growth, and assisted or attributed organic revenue are the four metrics with a direct, reliably attributable connection to money changing hands. Each is worth its own line in a report; everything else on this page exists to explain why.
Segmented Conversion Rate by Channel
Segmented conversion rate is the percentage of visitors from a specific channel who complete a defined goal, whether that’s a form fill, a demo request, or a purchase, measured separately for each traffic source rather than blended into a single site-wide number.
This matters because a blended conversion rate hides exactly the information you need. If organic search converts at 2% and paid search converts at 10%, a blended average of 6% tells you nothing actionable. Segmenting by channel, and ideally by landing page and query intent within organic, shows you which parts of your search visibility are actually working and which are just adding noise to the traffic total.
For pages targeting genuinely high-intent, bottom-of-funnel commercial queries, a well-optimized organic conversion rate often lands in the 5% to 8% range or higher, though this varies significantly by industry, average order value, and how far along the buying journey the query sits.
A page converting well below that range for a high-intent query is usually a page problem, not a traffic problem: check the offer, the trust signals, and the page’s actual match to what the visitor was looking for before assuming the traffic itself is low quality.
Cost Per Conversion (Blended CAC)
Cost per conversion is what it costs, in fully-loaded time and resource investment, to generate one conversion through organic search. For a channel that doesn’t have a direct media spend line like paid search does, this usually means dividing the fully-loaded cost of content, technical work, and link building over a period by the number of conversions that period’s organic traffic produced.
The reason this metric matters more than almost any other on this list is that it’s the one that determines whether SEO is actually profitable, independent of how good the traffic numbers look. A channel producing thousands of visits and dozens of leads can still be a bad investment if the cost to produce that content and maintain those rankings exceeds what those leads are worth. Comparing cost per conversion in organic search against the same figure in paid channels is the fastest way to show whether SEO deserves more budget or less.
Typical costs per conversion vary enormously by industry and competitiveness of the target keywords, so treat any specific number you see elsewhere as illustrative rather than a target to hit. What matters is the trend for your own business over time, and how that number compares to what the same conversion costs through your other channels.
Branded Search Growth
Branded search growth tracks the change in share of search volume for your company name, product names, or other terms that only make sense if someone already knows who you are.
This is a slower-moving, more indirect metric than the other three, but it earns its place on this list because it’s one of the few SEO-adjacent signals that reflects demand generation happening outside of search entirely. When branded search volume grows month over month, it usually means your other marketing, word-of-mouth, or reputation is working, and it often precedes growth in direct and non-branded organic traffic as more people who’ve heard of you go looking for more information.
A flat or declining branded search trend, even while non-branded rankings hold steady, is often the earliest warning sign that overall demand for your business is softening before it shows up anywhere else in the funnel.
Assisted and Attributed Organic Revenue
Assisted and attributed organic revenue is the actual dollar value connected to users whose journey included an organic search touchpoint, tracked through your analytics platform or CRM rather than inferred from traffic volume alone.
The distinction between “assisted” and “last-touch attributed” matters. Last-touch attribution only credits organic search when it was the final step before a conversion, which understates its role in longer buying journeys where someone might discover you through search, leave, and convert later through a direct visit or an email link.
Assisted revenue credits organic search whenever it appeared anywhere in the path to conversion, which gives a fuller picture but requires multi-touch tracking set up correctly to avoid double-counting across channels.
This is the metric that closes the loop between all of the others. Conversion rate and cost per conversion tell you about efficiency. Branded search tells you about demand. Assisted and attributed organic revenue tells you, in the currency your business actually runs on, whether the whole effort is worth it.
Typical Benchmark Ranges by Business Model
A single set of benchmark numbers rarely applies across different types of businesses, because the sales cycle, average order value, and what counts as a “conversion” are fundamentally different. The ranges below are general, directional guidance, not a substitute for your own historical data, and should be treated as a starting point for a conversation about what “good” looks like for your specific business rather than a target to hit.
| Business model | Typical organic conversion rate | What counts as a conversion | Branded search growth signal |
|---|---|---|---|
| Lead-gen / local service | 3% to 8% on high-intent pages | Form fill, phone call, booked estimate | Steady month-over-month growth tracks with local reputation and word-of-mouth |
| Ecommerce | 1% to 3% site-wide, higher on bottom-funnel product pages | Completed purchase | Growth often spikes around campaigns or press coverage, then settles to a baseline |
| SaaS / subscription | 2% to 5% for trial or demo signups | Trial start, demo request, signup | Slower, more gradual growth tied to brand awareness and content marketing maturity |
The columns matter more than the exact numbers. If you’re not tracking conversion rate segmented by channel, and you’re not distinguishing branded from non-branded search volume, you don’t yet have the data to know whether your organic search program is under-performing or over-performing relative to your own business model, regardless of what any external benchmark says.
How to Set Up Revenue Attribution for Organic Search
Most teams that struggle to connect SEO to revenue aren’t missing a framework, they’re missing the tracking infrastructure to feed one. The setup below is the minimum required to answer the metrics covered above with real data instead of estimates.
- Define conversion goals in GA4 before you need the report. Set up specific, named conversion events for the actions that actually matter to your business (form submits, purchases, demo requests), not just generic pageview or engagement events. A conversion metric is only as good as the goal definition behind it.
- Link Google Search Console to GA4. This connects query-level and page-level search performance data to on-site behavior and conversion data, which is what makes it possible to see which specific queries and pages are driving conversions, not just traffic.
- Separate branded from non-branded organic traffic. Build a segment or filter that isolates branded queries so branded search growth and non-branded conversion rate can be tracked independently. Blending the two hides the signal in both directions.
- Keep UTM and channel-grouping discipline consistent. If organic social, email newsletters, or other channels aren’t tagged consistently, some of their traffic and conversions will get misattributed to organic search (or the reverse), quietly distorting every metric downstream.
- Connect analytics conversions to actual deal or order value where possible. A form-fill conversion event is a proxy. Connecting that event to a CRM record and an eventual deal value, even imperfectly, is what turns “conversions” into “revenue” in the reports that actually matter to a finance team.
None of this is complicated individually. What breaks most attribution setups is skipping one of these steps and then trying to reverse-engineer clean numbers from incomplete data months later.
What SEO Metrics Don’t Predict Revenue
These metrics are commonly tracked, and worth watching for the reasons noted, but none of them reliably predicts revenue on their own.
- Domain authority or domain rating. A third-party score of overall backlink strength. It correlates loosely with ranking ability over time, but a high score guarantees nothing about whether visitors to your site want to buy anything.
- Total keyword rankings. Tracking hundreds of ranked terms, many with low or no commercial intent, inflates a sense of progress without moving revenue. Ranking growth only matters when it’s concentrated on queries with buying intent.
- Raw impressions. High impression counts mean your pages are appearing in search results. If the query intent doesn’t match what you sell, or the click-through rate stays low, impressions alone never become revenue.
- Site-wide organic traffic (blended). An aggregate traffic number treats a visitor who was ready to buy the same as one who landed on an unrelated blog post and left in five seconds. It’s a useful leading indicator of overall visibility, but it should never stand in for a revenue metric on its own.
These metrics still have a place in a leading-indicator dashboard, per the framework above. The mistake is reporting them as if they answer the revenue question, when they don’t.
Forecasting Revenue Impact Without Overpromising
Once you’re tracking the right metrics, the next temptation is to forecast future revenue from planned SEO work. This is worth doing, but it deserves real caution, because SEO forecasts are notoriously easy to get wrong with confidence.
There are two common approaches. Bottom-up forecasting starts from specific planned initiatives and sums their estimated individual impact: a new content cluster might be projected to add 4% to organic traffic, a technical fix another 2%, arriving at a combined estimate. Top-down forecasting works in the opposite direction: set a target (say, 20% more organic revenue this year) and then work backward to identify which initiatives could plausibly close that gap. Bottom-up tends to produce more defensible, if more conservative, numbers, because each component can be checked against reality as it ships.
Whichever approach you use, build in explicit caution around the things that reliably break forecasts: algorithm updates that can shift rankings independent of anything you did, seasonal demand swings that have nothing to do with your SEO work, and the simple fact that search demand for a given topic can rise or fall for reasons entirely outside your control.
A forecast that doesn’t name its own confounders isn’t a forecast, it’s a promise you can’t actually keep.
Quick Answers
Which SEO metrics actually predict revenue?
Segmented conversion rate by channel, cost per conversion, branded search growth, and assisted or attributed organic revenue are the four metrics with the most direct, reliable connection to actual revenue.
Why don’t rankings and traffic predict revenue on their own?
They measure visibility, not buyer intent. A page can rank highly and generate large amounts of traffic on a query that was never a buying query, producing plenty of visibility and no revenue.
What SEO metrics should I stop reporting as revenue indicators?
Domain authority, total keyword ranking counts, raw impressions, and blended site-wide traffic are all worth monitoring as leading indicators, but none of them should be presented as evidence of revenue impact on their own.
How do I connect SEO to revenue if I haven’t tracked it before?
Start with the setup checklist above: define real conversion goals in GA4, link Search Console to GA4, separate branded from non-branded traffic, and connect conversion events to actual deal or order value wherever your CRM or ecommerce platform allows it.
