
How to Use Google Search Console Keywords for SEO (Complete Guide)
Google Search Console is one of the most underrated free tools in any SEO or content marketer’s stack. While paid platforms like Ahrefs and Semrush estimate search volume based on models, GSC shows you what actually happened: real search queries, real impressions, real clicks, real positions, straight from Google’s own data.
The problem is that most users barely scratch the surface. They open the Performance report, glance at their top queries, and close the tab. That leaves the most valuable part of GSC keyword data entirely untouched: finding striking distance pages, detecting cannibalization, and uncovering content gaps your current strategy is missing.
This guide covers everything you need to know about Google Search Console keywords, from what they are to six specific ways to turn that data into more organic traffic.
What Are Google Search Console Keywords?
Google Search Console keywords are the search queries that triggered your pages to appear in Google’s search results. When someone types a query into Google, Google decides which pages to show. If it shows one of your pages (even if the user never clicks), that query gets recorded in your GSC data.
You’ll find this data in the Performance report under the Queries tab. GSC breaks each query down into four metrics:
- Clicks: How many times users clicked through to your page from that query.
- Impressions: How many times your page appeared in Google results for that query.
- CTR (Click-Through Rate): Clicks divided by impressions, expressed as a percentage.
- Average Position: The mean ranking position your page held for that query over the selected date range.
Together, these four numbers give you a complete picture of how any keyword is performing for your site.
One thing worth knowing: even if a query appears in your GSC data, you might not see your site for that query in a live Google search. Personalization factors like your location, device, and search history can affect what Google shows you directly. That’s not a data problem; it’s just how Google personalizes results.
Why Use Google Search Console for Keyword Research?
The main advantage GSC has over third-party tools is that its data comes directly from Google. There’s no modeling, no volume estimation, no clickstream extrapolation. If Google showed your page for a query 500 times last month, GSC reports exactly 500 impressions.
Here’s why that matters:
- It shows what you already rank for. No third-party tool can give you real impression data for low-volume queries on your specific domain. GSC can.
- It’s completely free. Paid keyword tools start at $99 or more per month. GSC gives you your own keyword data at zero cost.
- It surfaces opportunities you can’t find any other way. A page at position 18 with 2,000 impressions is a striking distance opportunity. That data only exists in GSC because you own the property.
- Its queries are intent-validated. Users actually typed these things. That’s stronger evidence of search demand than any keyword model.
GSC isn’t a full replacement for tools like Ahrefs when you need competitive research on keywords you don’t yet rank for. But for optimizing what you already have, nothing comes close.
How to Access Keyword Data in Google Search Console
- Log in at search.google.com/search-console and select the property you want to analyze.
- Click Performance in the left sidebar, then select Search results.
- Enable all four metric toggles at the top: Total clicks, Total impressions, Average CTR, Average position.
- Scroll down to the Queries tab beneath the chart. That’s your keyword list.
- Set a longer date range. The default 28-day window is too short for trend analysis. Use at least three months.
That’s your baseline view. Every tactic covered below starts from this same Performance report.
6 Ways to Use Google Search Console Keywords to Grow Organic Traffic
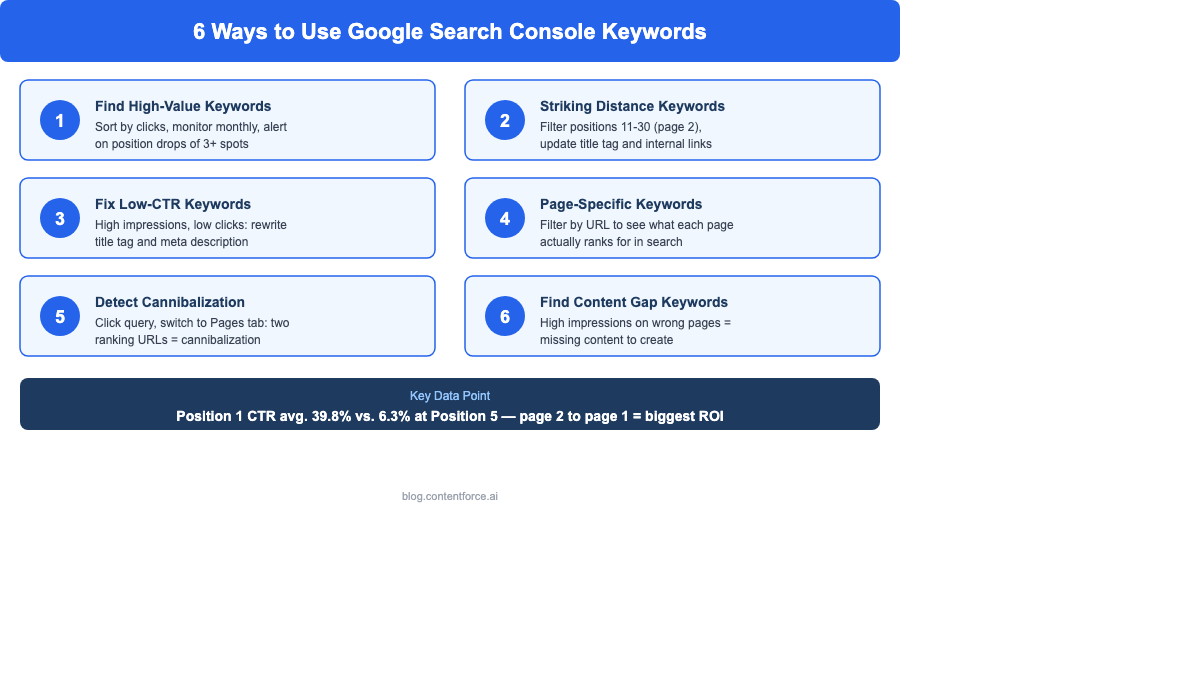
1. Find Your High-Value Keywords (and Protect Them)
Sort the Queries tab by clicks, highest to lowest. The queries at the top are your traffic drivers, the keywords actively sending visitors to your site right now.
These need monitoring. A position drop of two or three spots on a high-traffic keyword can cost you a noticeable number of clicks, because click-through rates fall steeply as positions decline.
What to do with this list:
- Export it once a month and save it in a keyword tracker spreadsheet.
- Flag any query where your average position has dropped by more than three spots compared to the prior period.
- If a previously strong keyword is slipping, check the page for freshness issues, thin sections, or competitors who’ve published stronger content recently.
This monthly snapshot becomes your early warning system for traffic erosion before it shows up as a visible drop in your analytics.
2. Discover Striking Distance Keywords (Page 2 Quick Wins)
Click Average position in the Queries tab to sort by ranking, then filter for queries where your average position sits between 11 and 30. These are your striking distance keywords.
A page at position 11 to 20 is sitting on page two of Google’s results, essentially invisible to most searchers. But it’s already indexed, already trusted to some degree, and already appearing for the right query. That’s most of the hard work done.
Moving from position 15 to position 7 typically generates a significant increase in clicks. The CTR difference between page two and the upper half of page one is substantial, and you’re not starting from scratch. You’re pushing an already-ranking page over a threshold it’s close to crossing.
Tactics to move striking distance keywords:
- Rewrite the page’s title tag to better match the query’s intent.
- Add a short FAQ block that directly answers the target query.
- Strengthen internal linking to the page from related content on your site.
- Expand whichever section of the page is most relevant to the target query.
Start with your highest-impression striking distance keywords. Those are the ones where the traffic upside is largest if you can push them onto page one.
3. Fix Low-CTR Keywords (High Impressions, Few Clicks)
Sort your Queries by impressions, highest first, then look for keywords where the CTR is below two or three percent despite strong impression counts.
That’s your missed opportunity list. Google is showing your page thousands of times, but users are picking other results.
For reference: the average CTR for a position 1 result is around 39.8 percent. Position 5 averages around 6.3 percent. If you’re ranking in the top five for a high-impression keyword but seeing a CTR of one or two percent, something about your SERP snippet is working against you.
How to fix it:
- Rewrite the title tag. Add the current year, a power word, or a clearer intent match (“how to,” “complete guide,” “free template”).
- Rewrite the meta description. It should preview the specific value the user gets from clicking, not just describe the page’s topic.
- Check the featured snippet. If a competitor holds the snippet, your result gets pushed below it and receives a fraction of normal CTR. The fastest fix is adding a concise direct answer near the top of the page to compete for that position.
4. Identify Page-Specific Keywords
The default Queries view shows your entire site’s keyword data. One of the most useful things you can do in GSC is filter by a single page instead.
Click the Pages tab, select a specific URL, then switch back to the Queries tab. You’ll now see only the queries that triggered that particular page. This reveals what a page actually ranks for, which is often surprising.
Common discoveries from this view:
- A blog post showing up for commercial keywords it wasn’t written to convert.
- A landing page appearing for informational queries that should go to a separate article.
- A thin page getting impressions for 15 or 20 related queries, a strong signal to expand the content so it serves all of them.
Use this analysis to decide whether a page needs to be expanded, split into two separate URLs, or linked more strategically to funnel certain queries to a better-matched destination.
5. Detect Keyword Cannibalization
Keyword cannibalization happens when two or more of your pages compete for the same query. Google splits its ranking signals between them, so neither page performs as well as it could on its own.
You can spot this directly in GSC. In the Queries tab, search for a keyword you want to check. Click on that query, then switch to the Pages tab. If two or more of your pages appear as ranking URLs for the same query, you’ve got a cannibalization problem.
How to fix it:
- If one page is clearly stronger and more relevant, consolidate the weaker page’s content into it and redirect the old URL.
- If both pages serve genuinely different angles of the same topic, add a canonical tag pointing to the primary page, or differentiate the content enough that Google can distinguish between them.
- If one page is ranking accidentally (a category page ranking for a specific guide’s keyword, for instance), improve internal linking so the right page gets more authority.
6. Find Content Gap Keywords
This tactic looks for queries where Google is already matching your domain to user intent, but the wrong page is appearing.
Look for high-impression queries with zero clicks where the ranking URL is a homepage, category page, or product page rather than a piece of content that actually addresses the query.
When Google serves your homepage for an informational query like “how to do X,” it’s signaling that your site is topically relevant. You just don’t have a page that answers the question well. That’s a content gap: a topic worth building a dedicated article around.
These are particularly high-value content opportunities. Google has already decided your domain belongs in the conversation. You don’t need to build authority from zero; you just need to create the right page.
How to Export Google Search Console Keyword Data
To export your keyword data, click the download button at the top right of the Performance report. You can choose Google Sheets or CSV.
Recommended workflow:
- Export once per month and include the date in the filename so you can compare over time.
- Store exports in a central keyword tracker where you track position, CTR, and impression volume changes.
- Each month, review your top 50 queries and flag anything that’s shifted.
What to look for in each export:
- Clicks dropped but impressions held: CTR problem. Fix the SERP snippet.
- Both clicks and impressions dropped: likely a ranking loss. Check for content freshness issues or an algorithm impact on your niche.
- Impressions rising but clicks still low: opportunity growing. Worth prioritizing an optimization run.
For larger sites, the GSC API allows up to 50,000 rows of query data per day, compared to the 1,000-row interface limit. If you’re regularly hitting the row cap in the interface, the API is definitely worth setting up.
Advanced Google Search Console Keyword Tactics
Filter by Device (Mobile vs. Desktop)
In the Performance report, click the plus button above the chart and add a Device filter. Compare your keyword performance on mobile versus desktop side by side.
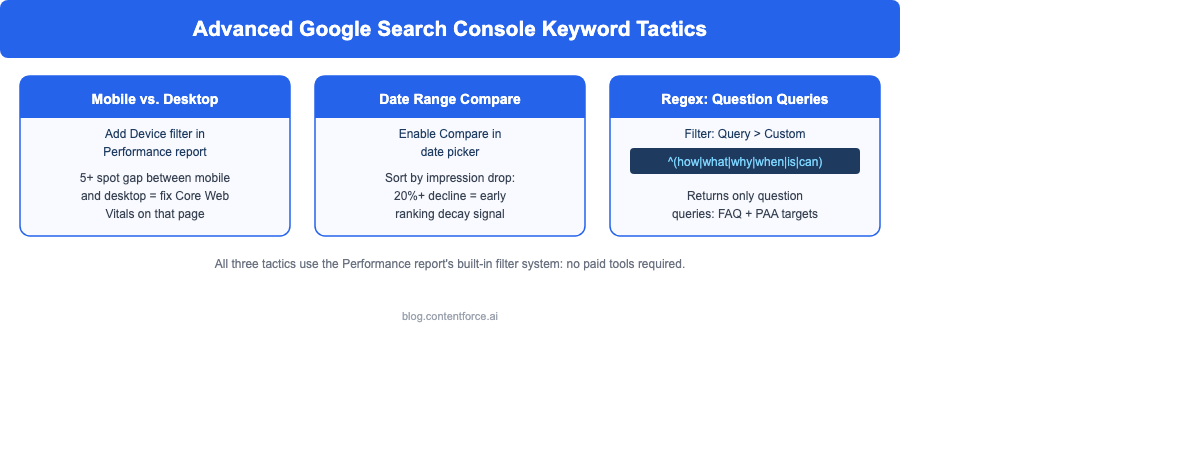
It’s common to find keywords where your desktop position is strong (position 4 or 5) but your mobile position is significantly worse (position 12 or 15). This happens when a page’s mobile experience is poor: slow load times, layout issues, or unreadable text sizes. Google will rank the page lower on mobile even if the content itself is high quality.
When you find mobile-desktop gaps of five or more spots on high-impression keywords, run the affected page through Google’s PageSpeed Insights and check your Core Web Vitals. Mobile performance improvements can move those rankings without touching the content at all.
Compare Date Ranges to Find Declining Keywords
Open the date range picker in the Performance report and enable the Compare feature. Compare the last three months against the three months before that.
Sort the resulting query table by impressions change, lowest first. That surfaces your fastest-declining topics, keywords where impression volume has dropped. These are early signals of ranking decay, often caused by content going stale, competitors publishing stronger versions, or algorithm updates affecting your niche.
Any keyword showing a 20 percent or greater impression drop over a previously stable period is worth investigating. Check whether the content has become outdated, whether the SERP intent has shifted, and whether a competitor has recently published something more comprehensive.
Use Regex Filtering for Question Keywords
In the Performance report, click the filter icon next to the search bar, choose Query, then select Custom (regex). Enter:
^(how|what|why|when|where|is|can|does|are|will)This returns only question-style queries from your keyword data. Questions are the highest-priority targets for FAQ sections, featured snippets, and People Also Ask placements.
Review the question keywords your site already ranks for. Any with strong impressions but low CTR is a candidate for a direct FAQ answer on the relevant page. Any question keyword between position 11 and 30 is a candidate for a standalone FAQ article or a dedicated FAQ expansion on an existing post.
Common Mistakes When Using Google Search Console Keywords
- Using the 28-day default date range. That window’s too short to see trends, seasonal patterns, or gradual ranking drift. Extend to at least three months by default.
- Ignoring impressions. Most people focus only on clicks and miss the opportunity signals hiding in impression data. High-impression, low-click queries are your most actionable targets.
- Never filtering by page. Site-wide data gives you an overview, but page-level filtering is where the specific, actionable insights live.
- Treating GSC as a standalone tool. GSC shows which keywords drive traffic. GA4 shows whether that traffic converts. Use both together to prioritize which wins actually matter for your goals.
- Skipping date comparisons. Without period-over-period comparison, you can’t tell whether your rankings are stable, improving, or quietly declining. Make it a monthly habit.
FAQ: Google Search Console Keywords
How often does Google Search Console update keyword data? GSC updates roughly every 24 to 72 hours. There’s typically a two to three day lag between when a search happens and when it shows up in your Performance report.
Does Google Search Console show all the keywords I rank for? No. GSC omits low-volume queries to protect user privacy. Specifically, queries that aren’t issued by more than a small number of users in a given period get anonymized and excluded from the Queries table (though they’re still included in chart totals). For high-traffic sites, GSC also samples data beyond the 1,000-row interface limit. Your real keyword footprint is always larger than what the table shows.
How many keywords does Google Search Console show? The interface shows up to 1,000 queries per report view. To access more, filter by individual page URLs or use the Google Search Console API, which allows up to 50,000 rows per day.
Do I need a website to use Google Search Console for keyword research? Yes. GSC requires verified ownership of a web property. You can’t access keyword data for a site you don’t own or haven’t verified.
Is Google Search Console keyword data accurate? For your own website, yes. It’s Google’s own first-party data and more accurate than any third-party estimate for your existing rankings. The main limitations are that low-volume queries are anonymized and excluded from the table view, and the interface caps at 1,000 rows. The data quality itself isn’t in question. It comes directly from Google’s index.